Detailed guides from basic operations to advanced features.
How to use the Gantt chart
You can use Gantt charts on the Free plan. Gantt charts are useful for planning projects. This article explains how to use them effectively.
| Who can use it | Available on |
|---|---|
| All | All |
What is a Gantt chart?

A Gantt chart lists tasks on the vertical axis and time on the horizontal axis. It gives an easy-to-understand view of the schedule from the start to the end of the project.
You can see the project at a glance, including the order of tasks, due dates, and assignees.
With Repsona, you can easily create the following Gantt charts with just a click or drag-and-drop.
Gantt chart, Progress chart, Project schedule, Bar chart, Schedule chart, Project chart, Timeline, Progress report, Task management chart, and so on, depending on the type of job and industry.
How to make a Gantt chart
Click "Gantt" in the project menu.

Create a task list
First, list the tasks you want to manage in your project. Identify all tasks that you know at the time of planning. You can also use parent-child relationships to make the display easier to understand.
Set start/end (draw a bar)
To the right of each task is a date grid. Clicking it creates a “bar” where you can set the task’s schedule. You can move and resize the bar by drag-and-drop. The bar color is automatically determined by the assignee’s color, which you can change in user settings.
Adjust the timeframe and balance workloads (adjust bars)
Draw a bar for each task and adjust the start and end. Ensure there’s enough time, that work isn’t overly tied to a single due date, and that it isn’t concentrated on one person.
Tips for making Gantt charts
Bias adjustment
Use the "Responsible" grouping to see if work is skewed toward a particular person. In real projects, people aren’t working every minute of a timeline bar, so "overlapping bars = busy" doesn’t always hold. Discuss the plan with project managers and teammates, and adjust bars together to create a realistic schedule.
Aim for a solid first draft, not perfection
You can’t make a perfect plan from the start. Create a reasonable first draft—“something like this”—and move on. The time is better spent executing than polishing a plan endlessly.
Plans are living documents
When you make a plan, it’s easy to assume reality will follow it exactly. In practice, plans should evolve. Watch for signals outside the plan, take countermeasures, and regularly review and adjust. Let the plan grow with the project.
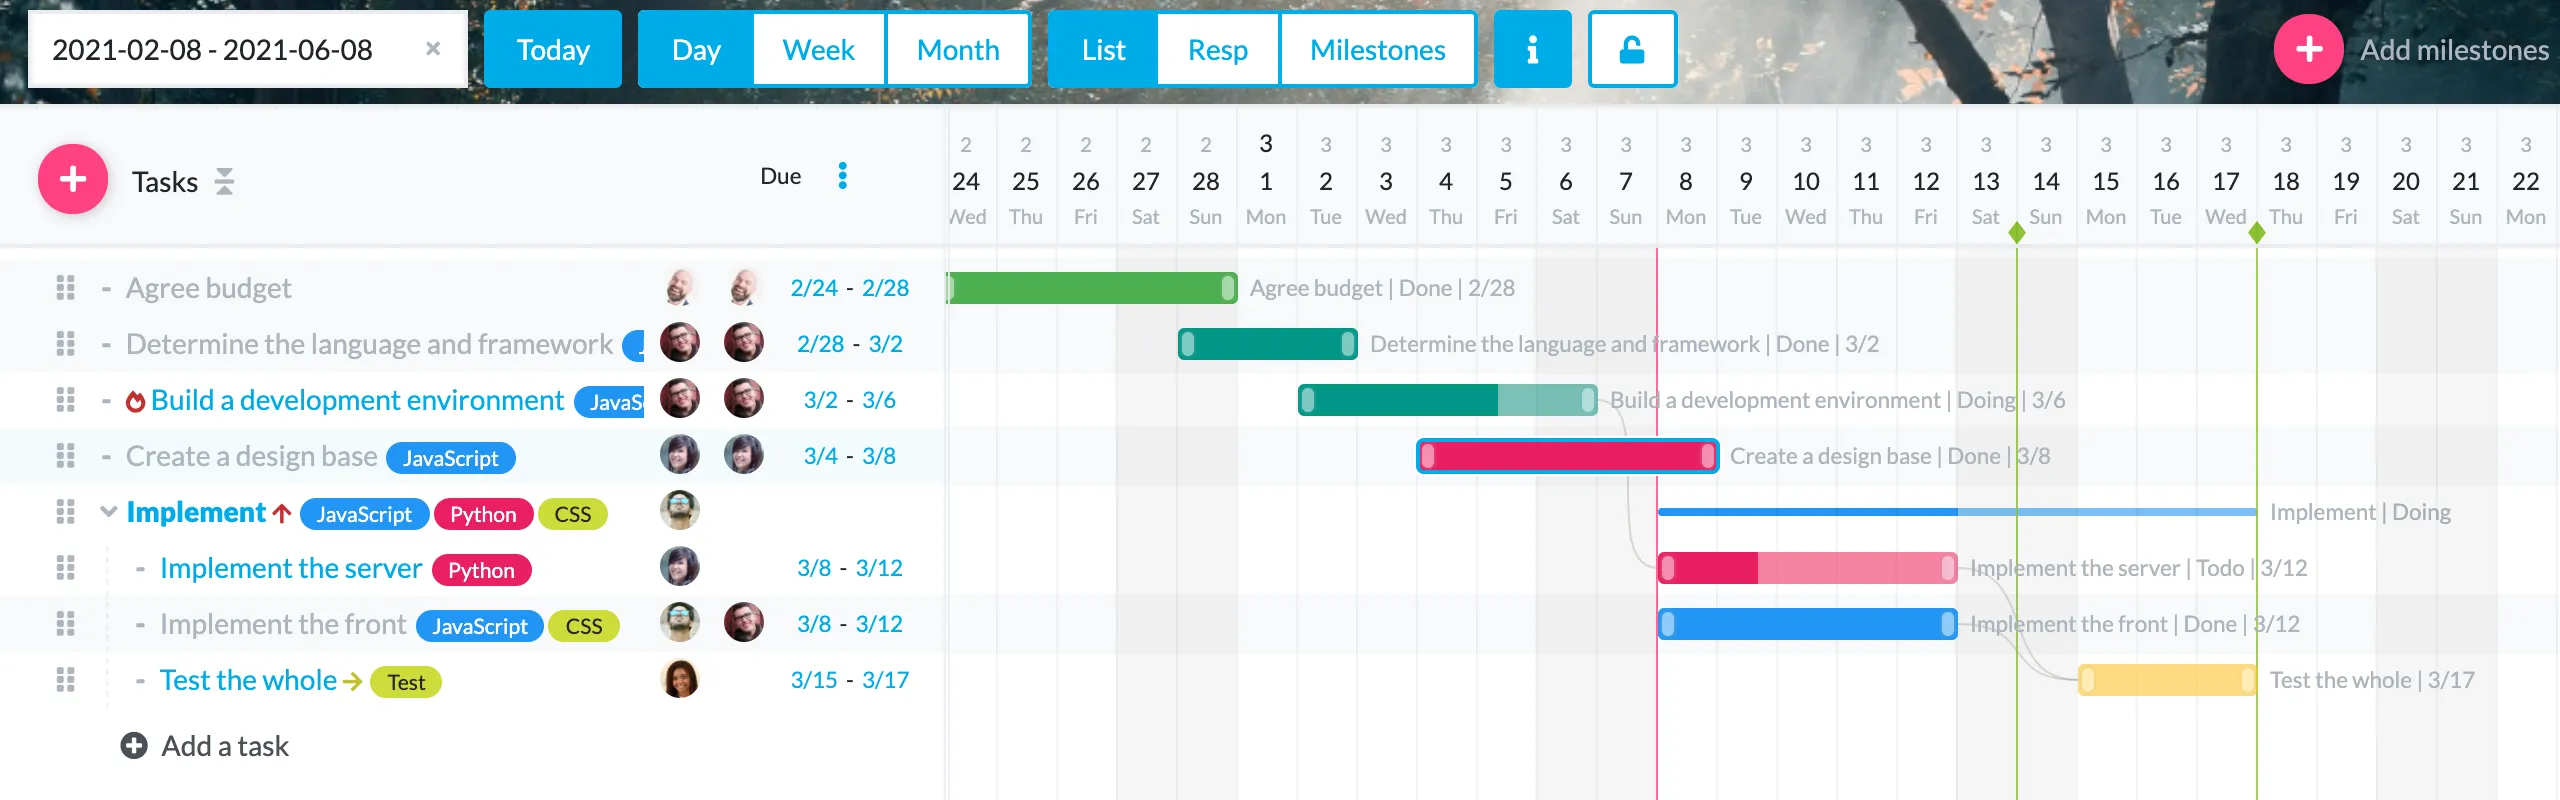
How to use the Gantt chart
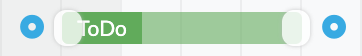
Check task progress
The dark part in the bar shows the progress rate of the task (the rate at which the status is nearing completion).
Check task details
Click the task name or bar to open the task details sidebar. You can change the assignee, update its status, add comments, and more.
Create and search tasks
You can create and search tasks in the same way as on the task list.
Set the display period
Click the button with "Display start date - Display end date" to display a calendar in which you can select the period. If you set the period on the calendar, you can set the display period of the Gantt chart. Click the cross button to reset to the default period. You can lock the display period with the lock button.
Jump to today
Click the "Today" button to scroll the Gantt chart to today's position.
View by day, week, or month
Click the "Day", "Week", and "Month" buttons to display the Gantt chart in units of each period.
Group by List, Assignee, Ball, or Milestone
Click the "Assignee", "Ball", and "Milestone" buttons to group and display the Gantt chart by each category. "List" is displayed without grouping.
Display information such as task name in the bar
Click the "i" button to display the task title, status, and due date to the right of the bar.
Lock Gantt chart edits
Click the padlock button to lock the Gantt chart edits (only affects yourself). The default is locked.
Display in due date order
Click the due date sort button to sort the tasks in the Gantt chart by due date. Since the parent-child relationship is maintained during sorting, subtasks are sorted within the due date of the parent task.
Display progress lines
Press the lightning line button to display progress lines.
Move task bars together
Press the move together button to be able to move task bars together. Tasks with parent-child relationships or dependencies will move together. Also, if you hold down Shift and select multiple tasks, the selected tasks can be moved together at the same time.
Undo and redo
By pressing the "Undo" and "Redo" buttons, you can return to the previous state or redo it.
Add milestones
You can add milestones by clicking the "Add Milestone" button and entering the milestone name and due date.
On the Milestone screen, set and group the tasks you want to complete by that milestone.
Adjust the area width of the Gantt chart
The line between the task list part and the date part can be adjusted by drag-and-drop.
Scroll the Gantt chart horizontally
You can scroll by using the scroll bar of the window or by dragging the date part.
Set task dependencies
Create task dependencies
When you hover your mouse over the bar, blue balls will appear on the left and right of the bar.
You can create a dependency by drag-and-drop the blue ball onto another task that has a dependency.
If the start of the successor task is set before the completion of the predecessor task, the dependency line will be displayed in red.
Remove task dependencies
Open the task details screen and open the details menu below where you want to set the responsible person and status.
Since the preceding task and the succeeding task are displayed, delete them with the cross button.
When is the Gantt chart useful?
Gantt charts are especially useful for looking at the entire project from a "time" perspective. You can visualize the flow from the beginning to the end of a project, how busy it is, task dependencies, and the resulting waits.
Gantt charts are useful when you want to schedule an overall project, or when you have an order or due date for task execution. Make sure you know who has to do what by when, and get the job done!
Exporting and Importing
Exporting and Importing, please see here
Data migration from Gantt-san to Repsona
Please see here for data migration from Gantt-san to Repsona